ARR per FTE: What You Need To Know
Understanding ARR (Annual Recurring Revenue) per FTE (Full-Time Equivalent)
In the landscape of business metrics and key performance indicators, ARR (Annual Recurring Revenue) stands out as a crucial measure for understanding a company's financial health and growth potential in the subscription-based business model. Combining this with the concept of FTE (Full-Time Equivalent), a measure of employee workload or the number of full-time employees needed, can provide insightful perspectives on efficiency, scalability, and revenue generation.
Openview Partners surveyed 3,000 Software As A Service (SaaS) companies and published the benchmarks in the above graph. Click here for the full report.
Openview Partners surveyed 3,000 Software As A Service (SaaS) companies and published the benchmarks in the above graph. Click here for the full report.
What is ARR?
ARR, or Annual Recurring Revenue, is a vital metric primarily used by subscription-based businesses to calculate the total yearly revenue that a company expects from its subscriptions. It accounts for the recurring portion of the revenue stream derived from subscription services or products over a defined period, usually a year.
The calculation of ARR involves multiplying the recurring revenue generated from subscriptions (monthly, quarterly, or annually) by the number of subscription periods within a year. For instance, if a company has 1,000 customers paying $100 per month for its subscription service, the ARR would be $1,200,000 ($100 x 12 months x 1,000 customers).
ARR is pivotal in assessing a company's financial stability, predicting future revenue streams, and demonstrating growth potential to investors and stakeholders.
Understanding FTE
FTE, or Full-Time Equivalent, is a unit of measurement to evaluate an employee's workload or the number of full-time employees required to complete a set amount of work. It's a standard method used to quantify a part-time employee's contribution concerning a full-time employee.
For example, if a company has 4 employees working 20 hours per week each, they would collectively represent 2 FTEs (4 employees x 20 hours ÷ 40 hours in a full-time workweek).
FTE helps businesses comprehend the workforce's overall capacity, efficiency, and resource allocation. It is commonly used for budgeting, staffing decisions, and assessing productivity.
ARR per FTE
Integrating ARR with FTE provides a unique perspective on a company's revenue generation efficiency concerning its workforce. It measures the revenue a company generates per full-time equivalent employee, showcasing the revenue-generating capability of each resource invested in the business.
The formula to calculate ARR per FTE is straightforward:
ARR per FTE=Annual Recurring Revenue/ Number of Full-Time Equivalent Employees
This metric helps understand how effectively a company utilizes its workforce to generate revenue. A higher ARR per FTE implies greater efficiency in revenue generation per employee, highlighting the company's ability to scale revenue without necessarily increasing headcount.
Significance and Applications
Efficiency Assessment: ARR per FTE aids in evaluating the efficiency of a company's workforce in revenue generation. It allows comparisons between different departments or time periods to identify areas for improvement.
Scalability and Growth: Monitoring changes in ARR per FTE over time can indicate the company's scalability. Consistent or increasing figures signify the ability to grow revenue without significantly expanding the workforce.
Resource Allocation: Companies can use this metric to optimize resource allocation by identifying departments or teams that might be more efficient in generating revenue per employee and directing resources accordingly.
Investor Confidence: Demonstrating a high ARR per FTE can instill confidence in investors, showcasing the company's ability to effectively utilize its human resources to drive revenue.
Take Action to Improve Your ARR per FTE
The best way to improve this metric is to track and set goals for the teams and employees that can influence the creation of new revenue. Sales quotas and commissions drive this behavior, but do your marketing and product teams have goals around how their activities drive more revenue for the company? You can also audit all the potential and existing growth drivers
to identify opportunities for testing and scaling. Contact us if you would like some advice or help in this area
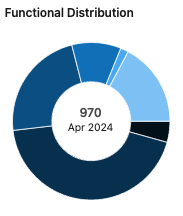
Full Transcript: 0:00 Alright, I'm a huge fan of Apollo, some great information, but sometimes it's not explained very well. And one of the areas that I noticed is under insights for company employee trends, like where are they hiring people. 0:15 So I created this video because I tried to find the answer, I could not find it. I'm pretty sure if I ping somebody there they would have gotten back to me, but you know I just want to figure out some of the stuff myself and not have to talk to somebody. 0:31 So, employee trends is pretty powerful. If you are selling products or services into different departments, you can see what's happening to their headcount. 0:41 And one of the things you can do under the departments is if you don't see one here, in the broad categories, you can actually pick some of the smaller categories here and add that in. 0:54 So, I'm going to look at support. And then what it will do is it will give you the total uhm new heads for the category added and then the year over year growth rate. 1:09 Now, what's really confusing is let's go to one of the bar charts. Sales, 425 out of 970 total new head count. 1:16 You know, roughly almost half. That kind of makes sense in the bar chart, but what it is is 0% in parentheses. 1:23 Well, that's actually the year over year growth rate. So pretty simple. It's not really explained anywhere. I had to figure it out myself and I hope this helps you.
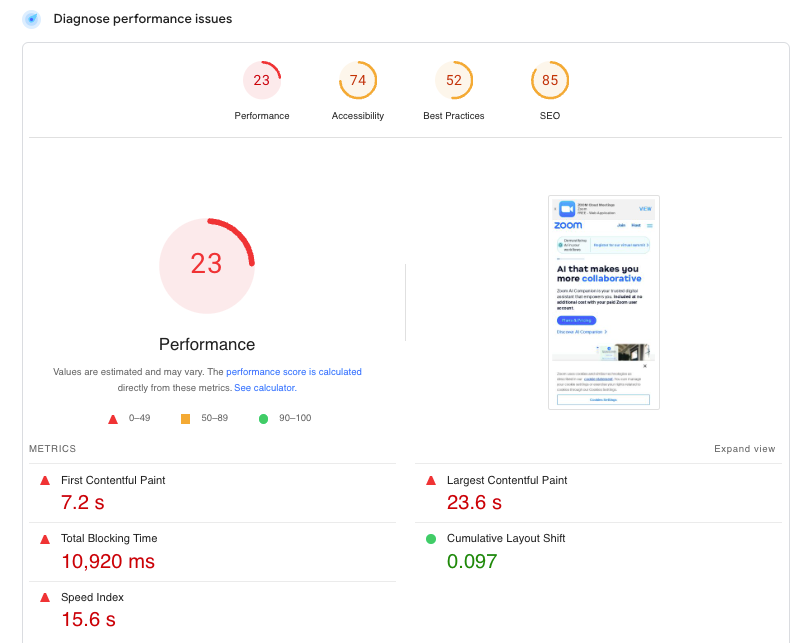
Your website speed can have a significant impact on your ability to both attract and engage your audience. Google provides several free tools like PageSpeed Insights to measure performance. So what does a bad score look like and what should you do about it?
Learn essential strategies for reducing your Saas costs and getting the most out of your software investments.
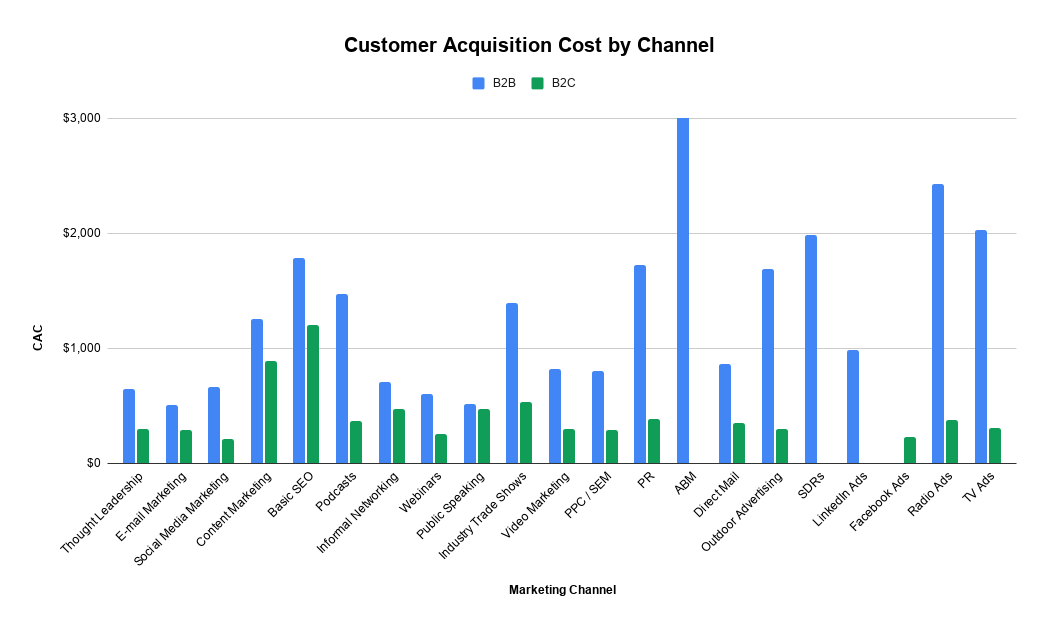
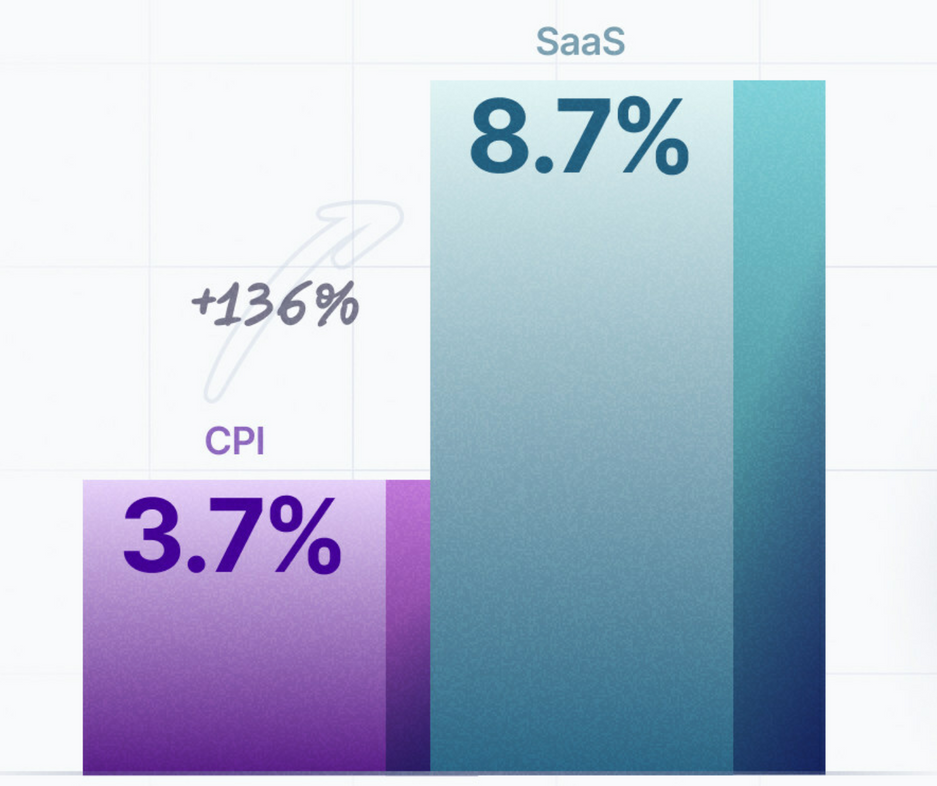
Get the latest 2023 and 2022 SaaS marketing benchmarks by industry on key marketing metrics, including customer acquisition cost (CAC) by channel, Cost Per Lead, Email marketing benchmarks, and marketing budget allocation by channel and activity. Dare to Compare!
In 2023, Win Rates Dropped 15%, Sales Cycles were 32% Longer, and 25% More Stakeholders Were Involved In The Process. Get SaaS Sales metrics win rates by ACV, ARR, days to close, the ratio of AE to SDR, AE Achievement of Quota, BDR and AE compensation. Dare to compare.