How to use Employee Trends In Apollo.io for Account Based Marketing
Use Apollo.io Employee Hiring Trends To Target The Right Accounts
Full Transcript:
0:00 Alright, I'm a huge fan of Apollo, some great information, but sometimes it's not explained very well. And one of the areas that I noticed is under insights for company employee trends, like where are they hiring people.
0:00 Alright, I'm a huge fan of Apollo, some great information, but sometimes it's not explained very well. And one of the areas that I noticed is under insights for company employee trends, like where are they hiring people.
0:15 So I created this video because I tried to find the answer, I could not find it. I'm pretty sure if I ping somebody there they would have gotten back to me, but you know I just want to figure out some of the stuff myself and not have to talk to somebody.
0:31 So, employee trends is pretty powerful. If you are selling products or services into different departments, you can see what's happening to their headcount.
0:41 And one of the things you can do under the departments is if you don't see one here, in the broad categories, you can actually pick some of the smaller categories here and add that in.
0:54 So, I'm going to look at support. And then what it will do is it will give you the total uhm new heads for the category added and then the year over year growth rate.
1:09 Now, what's really confusing is let's go to one of the bar charts. Sales, 425 out of 970 total new head count.
1:16 You know, roughly almost half. That kind of makes sense in the bar chart, but what it is is 0% in parentheses.
1:23 Well, that's actually the year over year growth rate. So pretty simple. It's not really explained anywhere. I had to figure it out myself and I hope this helps you.
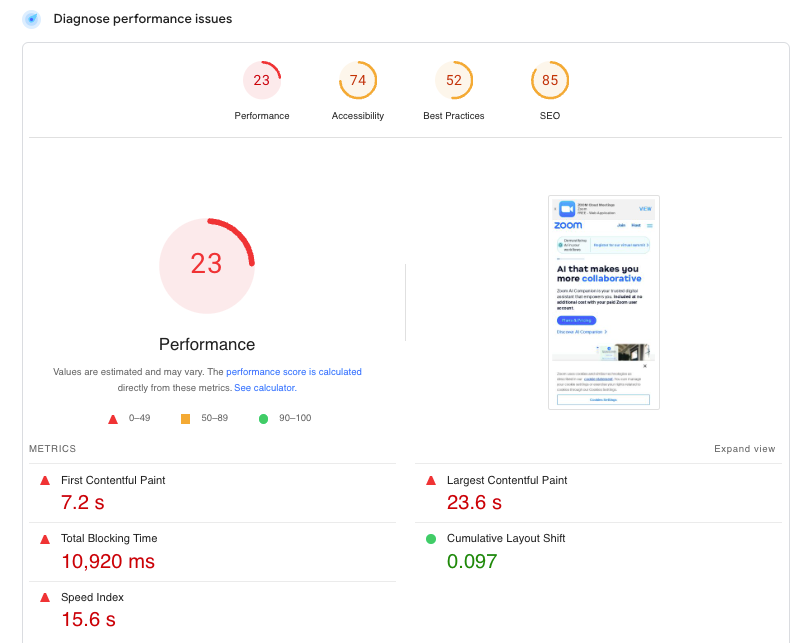
Your website speed can have a significant impact on your ability to both attract and engage your audience. Google provides several free tools like PageSpeed Insights to measure performance. So what does a bad score look like and what should you do about it?
Learn essential strategies for reducing your Saas costs and getting the most out of your software investments.
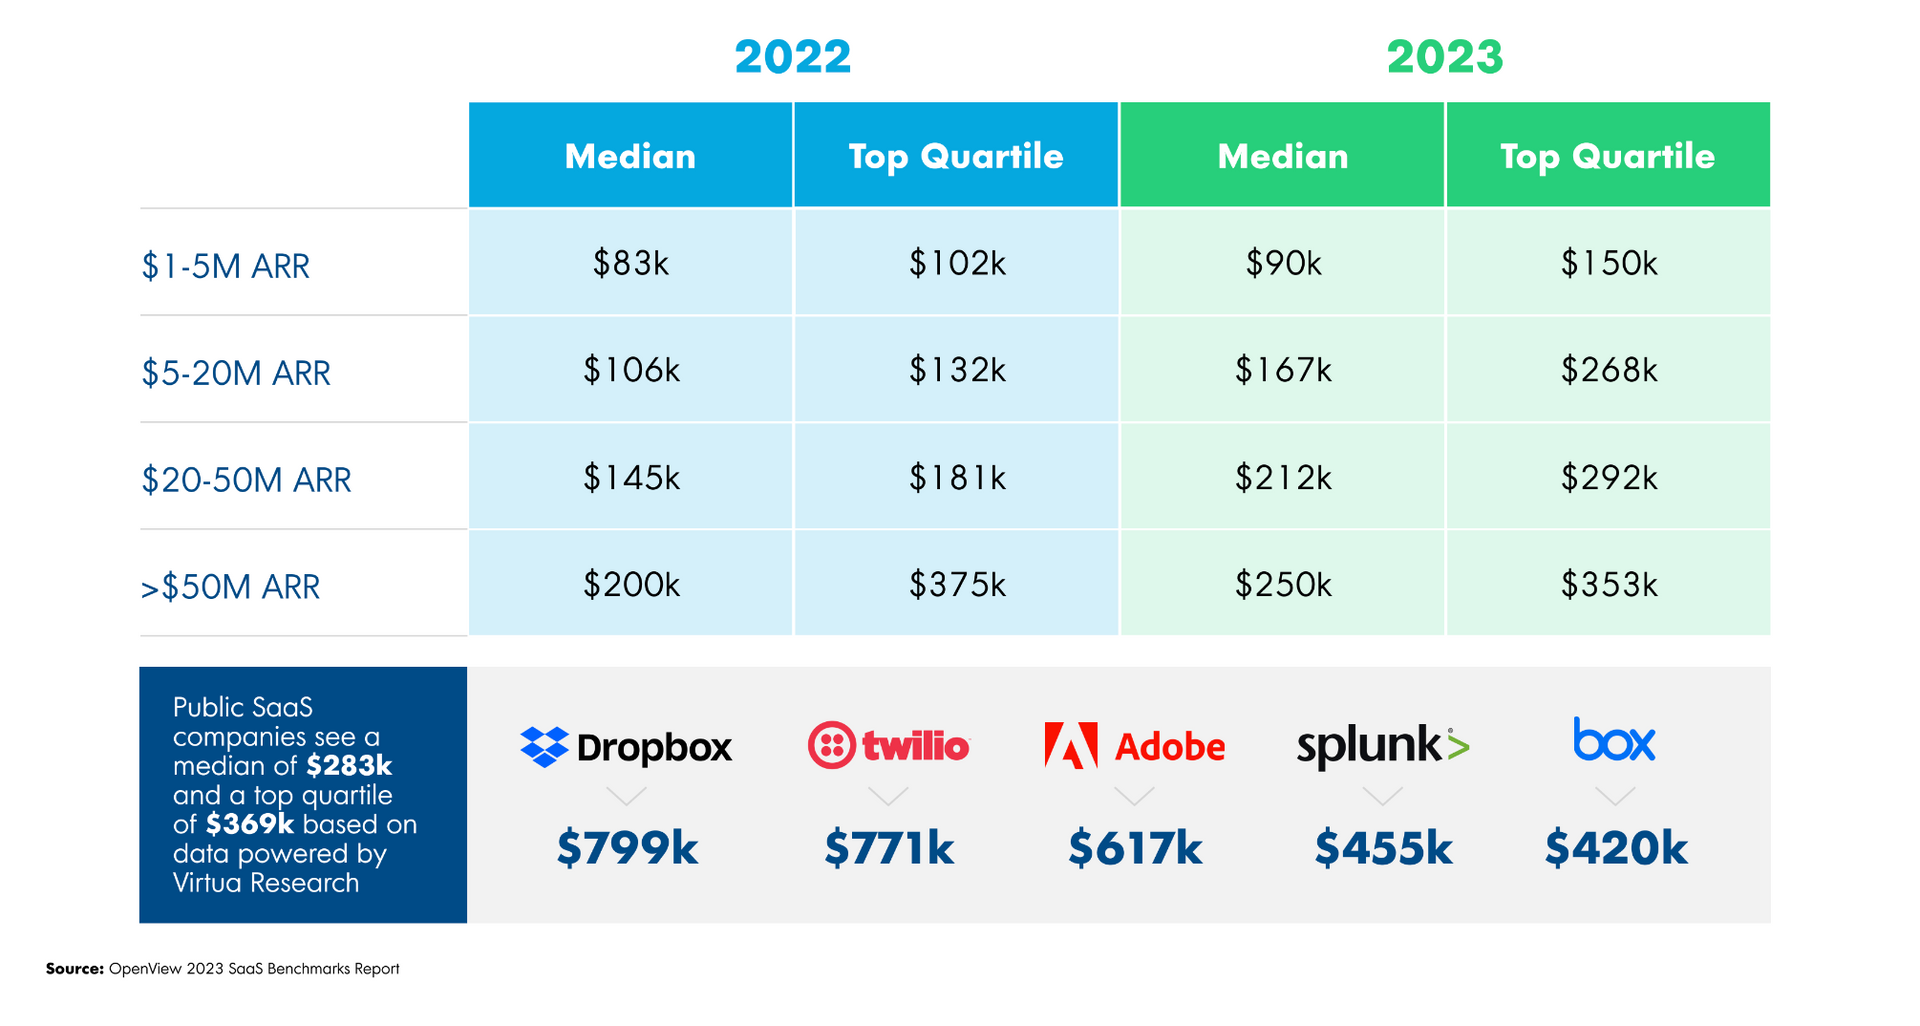
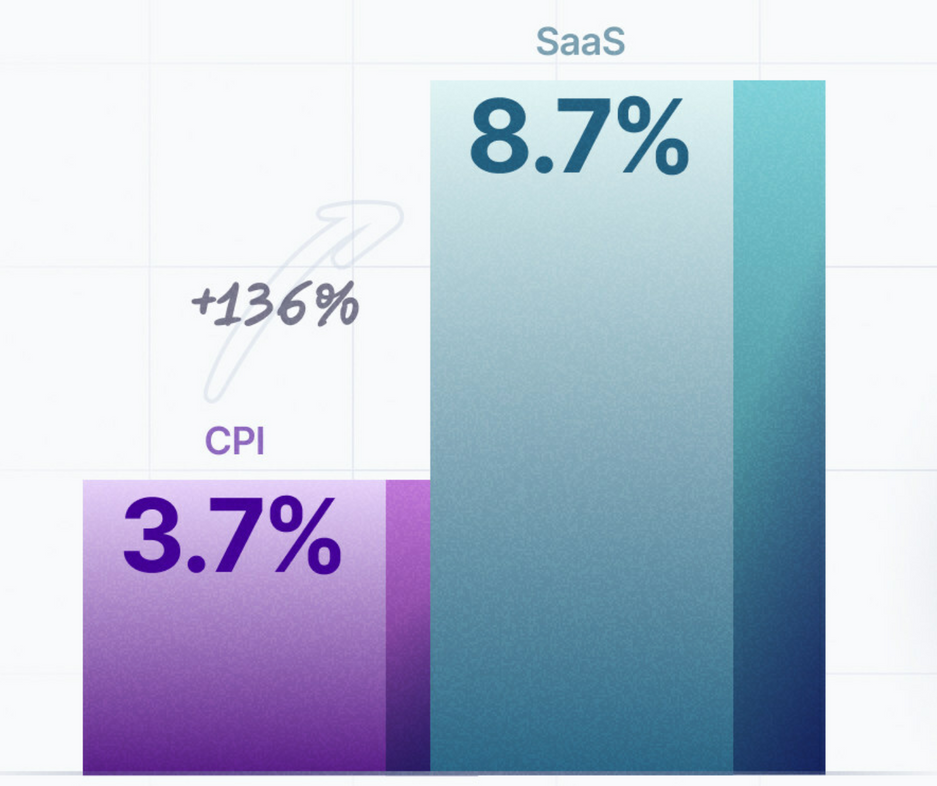
ARR per FTE is quickly rising as one of the most important metrics operators, investors, and owners are looking at to measure the performance of their SaaS based business. See the current benchmarks, how to calculate, and how to improve.
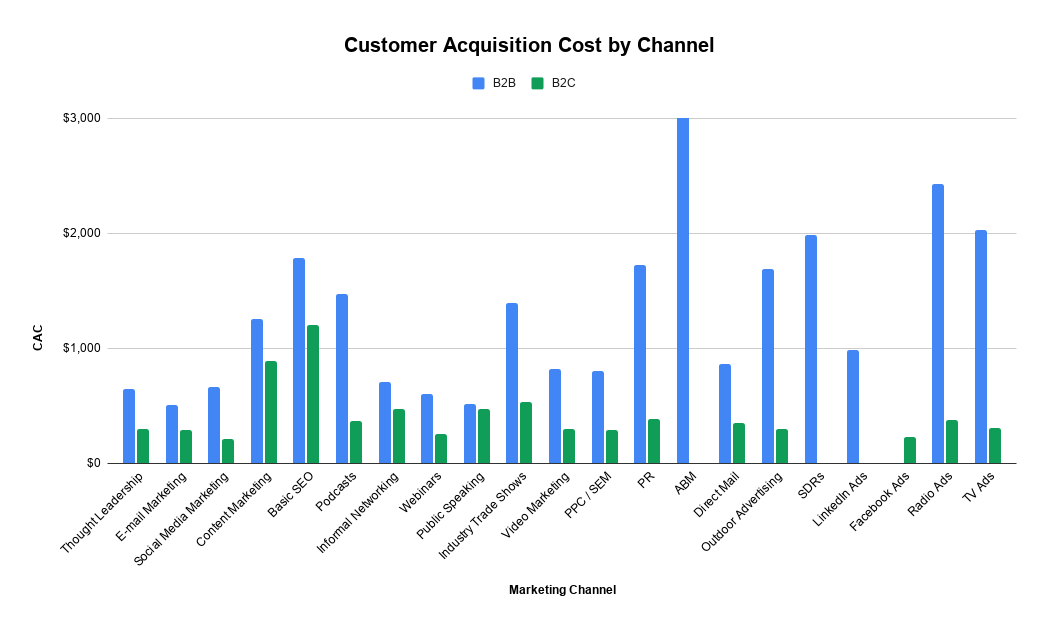
Get the latest 2023 and 2022 SaaS marketing benchmarks by industry on key marketing metrics, including customer acquisition cost (CAC) by channel, Cost Per Lead, Email marketing benchmarks, and marketing budget allocation by channel and activity. Dare to Compare!
In 2023, Win Rates Dropped 15%, Sales Cycles were 32% Longer, and 25% More Stakeholders Were Involved In The Process. Get SaaS Sales metrics win rates by ACV, ARR, days to close, the ratio of AE to SDR, AE Achievement of Quota, BDR and AE compensation. Dare to compare.