What is a Bad PageSpeed Insights Score?
TL;DR. If your PageSpeed Insights Score is less than 50 and your site speed index is more than 3 seconds, treat this as a priority.
- Green (90-100): Excellent performance, exceeding user expectations.
- Orange (50-89): Needs improvement, some areas impacting user experience.
- Red (0-49): Poor performance, significant optimization required.
- Speed Index: The time it takes for the content to show up during page load.
- First Contentful Paint: The time it takes for the first text or image to load.
- Total Blocking Time: The sum of time between First Contentful Paint and being able to interact with a website.
- Largest Contentful Paint (LCP): The time it takes for the largest text or image asset to load.
Considerations
- Industry benchmarks: A score of 80 might be considered good for a complex e-commerce site, while a news website should strive for closer to 90.
- Device type: Mobile scores tend to be lower than desktop scores due to slower network conditions and processing limitations.
- Core Web Vitals: These metrics, focusing on Largest Contentful Paint (LCP), First Input Delay (FID), and Cumulative Layout Shift (CLS), prioritize user experience and are weighted heavily in the overall score.
- Increased bounce rate: Users are more likely to abandon slow-loading websites.
- Lower conversions: Slow websites lead to fewer purchases and sign-ups.
- Negative SEO impact: Google prioritizes faster-loading websites in search rankings.
- 79% of online shoppers who encounter a slow-loading website will abandon their purchase. (source: Kissmetrics)
- 52% of mobile users will bounce from a page that takes more than 3 seconds to load. (source: Google)
- A 1-second delay in page load time can decrease conversions by 7%. (source: Portent)
- Google considers page speed a ranking factor. Websites that load slowly are more likely to appear lower in search results. (source Google Bard)
- A 1-second improvement in page load time can boost SEO conversion rates by 27%. (source: Think with Google).
- A 2-second delay in page load time can decrease mobile conversions by 20%. (source: Radware)
- For every 1 second of delay in page load time, Amazon loses $1.6 billion in sales. (source: Amazon)
- Identify the biggest bottlenecks: Analyze the diagnostic information to pinpoint the most impactful issues.
- Prioritize critical improvements: Focus on fixing issues affecting Core Web Vitals and overall performance.
- Implement recommended actions: PageSpeed Insights provides clear guidance on how to address specific issues.
- Monitor and iterate: Regularly track your score and adjust your optimization strategies as needed.
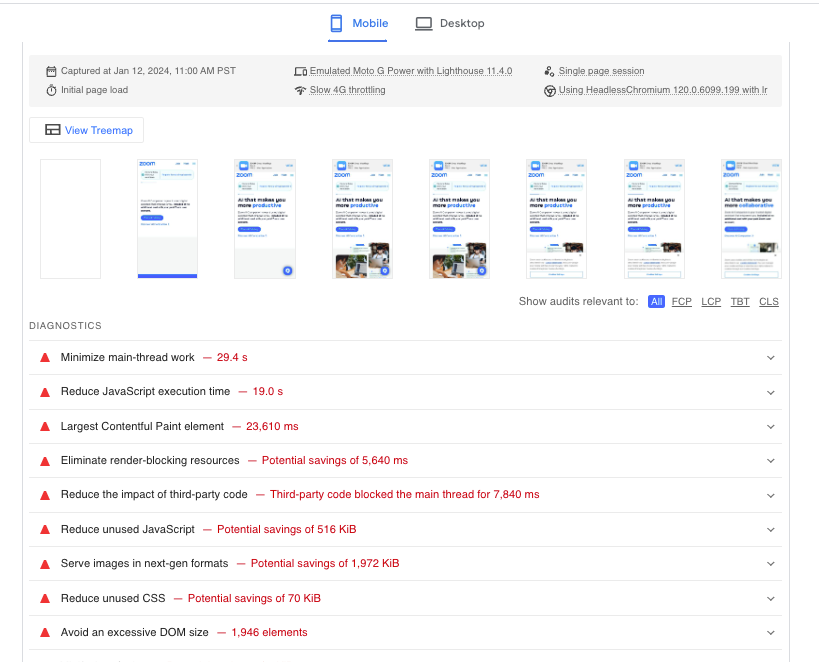
In the report (see example below) you will also get diagnostics to help you address the issue, and if you don't know where to start, send them to the person responsible for your website. In my case, I use the website publishing platform Duda, and within 1 day their customer support team provided me with help and a fix.
Additional Free Options To Test Your Website Performance: Lighthouse
In my opinion, I think the business owner/leader should use PageSpeed Insights for monitoring performance and the website developer should use Lighthouse to both monitor and fix. You can integrate Lighthouse into development workflows or use it independently from the PageSpeed Insights interface.
Google Lighthouse is an open-source, automated tool for improving the quality of web pages. It can be used on any publicly accessible webpage or web application, regardless of whether it requires authentication. Lighthouse runs a series of tests against the page and then generates a report on how well it did in several key areas.
Relationship to PageSpeed Insights
Lighthouse is the engine behind PageSpeed Insights. While PageSpeed Insights is a web interface that presents Lighthouse data and recommendations in a user-friendly format, Lighthouse is the actual tool that runs the audits. You can use Lighthouse independently from the PageSpeed Insights interface, for example, in your development workflow or as a Node module.
You access PageSpeed Insights by going to a URL, and you access Lighthouse by using a Chrome web browser and going to your website. Here is how to use Lighthouse:
- Download Google Chrome for Desktop.
- In Google Chrome, go to the URL you want to audit. You can audit any URL on the web.
- Open Chrome DevTools.
- Click the Lighthouse tab. To the left is the page's viewport that will be audited. ...
- Click Analyze page load. ...
- Click Run audit.
Ok, Let's Wrap It Up and Get To Work
By understanding what constitutes a bad PageSpeed Insights score, delving into the tool's functionality, and implementing data-driven optimization strategies, you can ensure your website delivers a fast and engaging experience for users, ultimately boosting your online success. Remember, a good PageSpeed Insights score is not just a vanity metric; it's a testament to your commitment to providing a seamless digital experience that keeps your audience engaged and coming back for more.
Additional Resources
- Google PageSpeed Insights: https://pagespeed.web.dev/
- Lighthouse: https://medium.com/impact-developers/how-to-set-up-automatic-lighthouse-testing-for-ci-cd-236cb955e968
- Core Web Vitals: https://developers.google.com/learn/pathways/web-vitalsNew Paragraph