Dare To Compare: 2023 SaaS Sales Benchmarks
How Do Your SaaS Sales Metrics Compare To Others?
Time for some data-driven group therapy.
1. You are not alone! Win Rates Dropped 15%, Sales Cycles were 32% Longer, and 25% More Stakeholders Were Involved In The Process.
These win rates, sales cycles, sales methodologies, and more from +3m B2B SaaS Opportunities analyzed by Ebsta and Pavilion. According to Ebsta: "In our third B2B Sales Benchmark Report, we have analyzed 3.2 million opportunities, from 364 companies, representing over $37 billion. Through the report, we explore B2B sales trends in 2022 and the impact of four key factors we have proved have the greatest effect on sales velocity: relationships, engagement, deal qualification and age.Whilst we use sales velocity as the ultimate measure(accounting for speed, efficiency and value), we also highlight the impact of factors on win rates, sales cycles and deal values.To be more representative, we have analyzed the performance of small, medium, and enterprise sales processes".
2. 20% of AE's hit 100% of Quota, aided by a 3:1 Ratio of AE to SDR's, and a 25% Win Rate.
BenchSights provides this data and breaks it down by ARR, ACV, and provides histogram nuance beyond the mean. BenchSights was started by SaaS pioneer David Spitz who in 2010 started the Pacific Crest SaaS Survey , which was the first benchmarking study of its kind, focused on SaaS company performance.
BenchSights provides this data and breaks it down by ARR, ACV, and provides histogram nuance beyond the mean. BenchSights was started by SaaS pioneer David Spitz who in 2010 started the Pacific Crest SaaS Survey , which was the first benchmarking study of its kind, focused on SaaS company performance.
3. What Trish says.
From the master of sales, crowd-favorite, and founder/CEO of The Bridge Group, Trish Bertuzzi, are two benchmark reports for SDR and AE's on how they spend their time, how they are paid, how long they stay, and who are they managed by.
From the master of sales, crowd-favorite, and founder/CEO of The Bridge Group, Trish Bertuzzi, are two benchmark reports for SDR and AE's on how they spend their time, how they are paid, how long they stay, and who are they managed by.
👉 I don't want to add another email to your inbox, so follow us on Linkedin
to receive upcoming posts on the top benchmark resources for marketing, product-led growth, customer success, and account management.
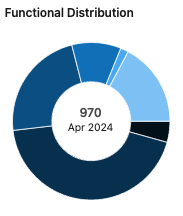
Full Transcript: 0:00 Alright, I'm a huge fan of Apollo, some great information, but sometimes it's not explained very well. And one of the areas that I noticed is under insights for company employee trends, like where are they hiring people. 0:15 So I created this video because I tried to find the answer, I could not find it. I'm pretty sure if I ping somebody there they would have gotten back to me, but you know I just want to figure out some of the stuff myself and not have to talk to somebody. 0:31 So, employee trends is pretty powerful. If you are selling products or services into different departments, you can see what's happening to their headcount. 0:41 And one of the things you can do under the departments is if you don't see one here, in the broad categories, you can actually pick some of the smaller categories here and add that in. 0:54 So, I'm going to look at support. And then what it will do is it will give you the total uhm new heads for the category added and then the year over year growth rate. 1:09 Now, what's really confusing is let's go to one of the bar charts. Sales, 425 out of 970 total new head count. 1:16 You know, roughly almost half. That kind of makes sense in the bar chart, but what it is is 0% in parentheses. 1:23 Well, that's actually the year over year growth rate. So pretty simple. It's not really explained anywhere. I had to figure it out myself and I hope this helps you.
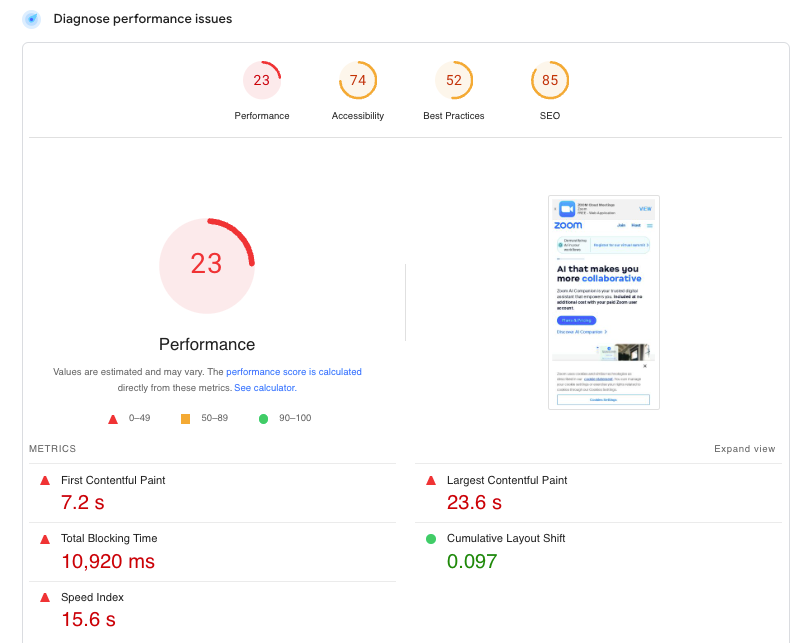
Your website speed can have a significant impact on your ability to both attract and engage your audience. Google provides several free tools like PageSpeed Insights to measure performance. So what does a bad score look like and what should you do about it?
Learn essential strategies for reducing your Saas costs and getting the most out of your software investments.
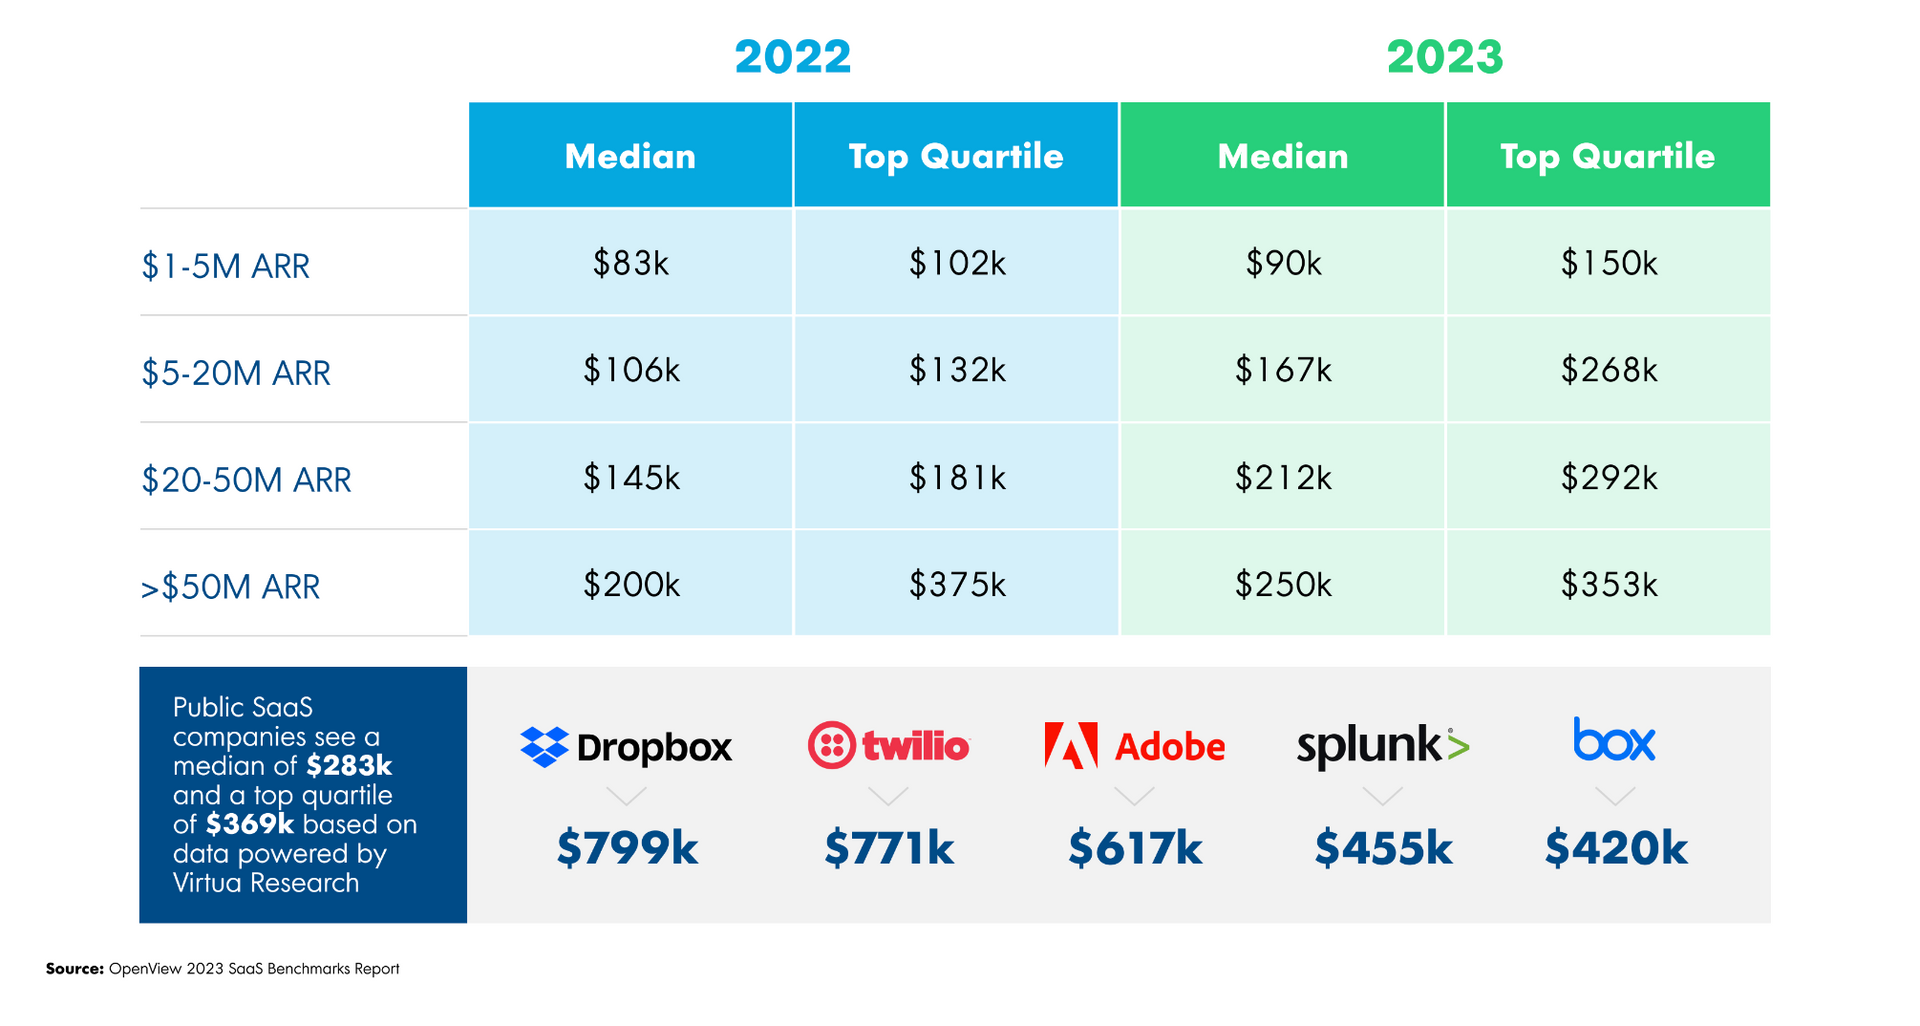
ARR per FTE is quickly rising as one of the most important metrics operators, investors, and owners are looking at to measure the performance of their SaaS based business. See the current benchmarks, how to calculate, and how to improve.
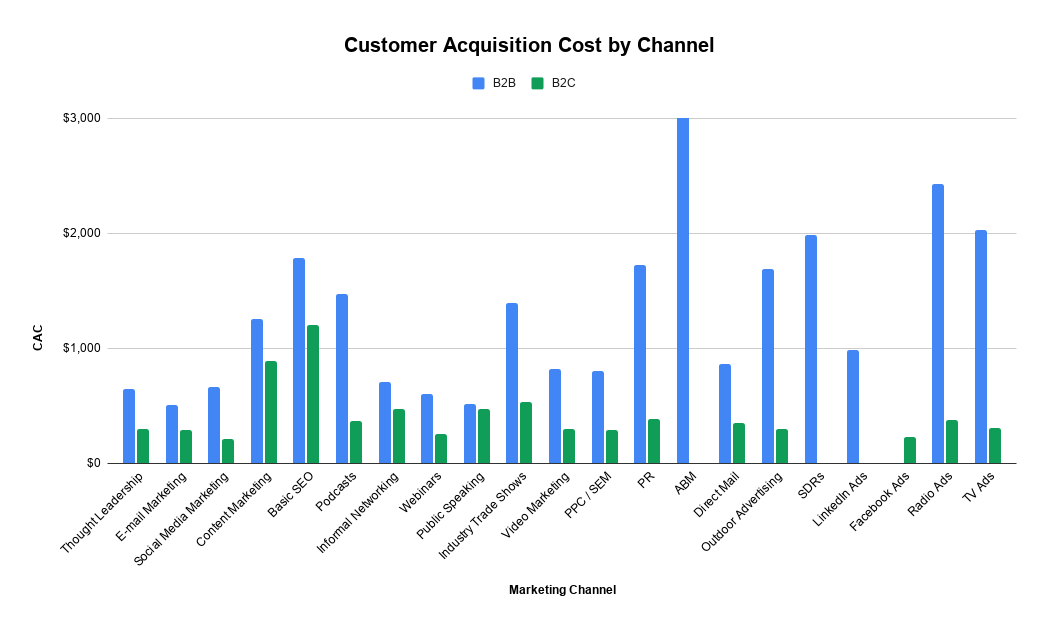
Get the latest 2023 and 2022 SaaS marketing benchmarks by industry on key marketing metrics, including customer acquisition cost (CAC) by channel, Cost Per Lead, Email marketing benchmarks, and marketing budget allocation by channel and activity. Dare to Compare!